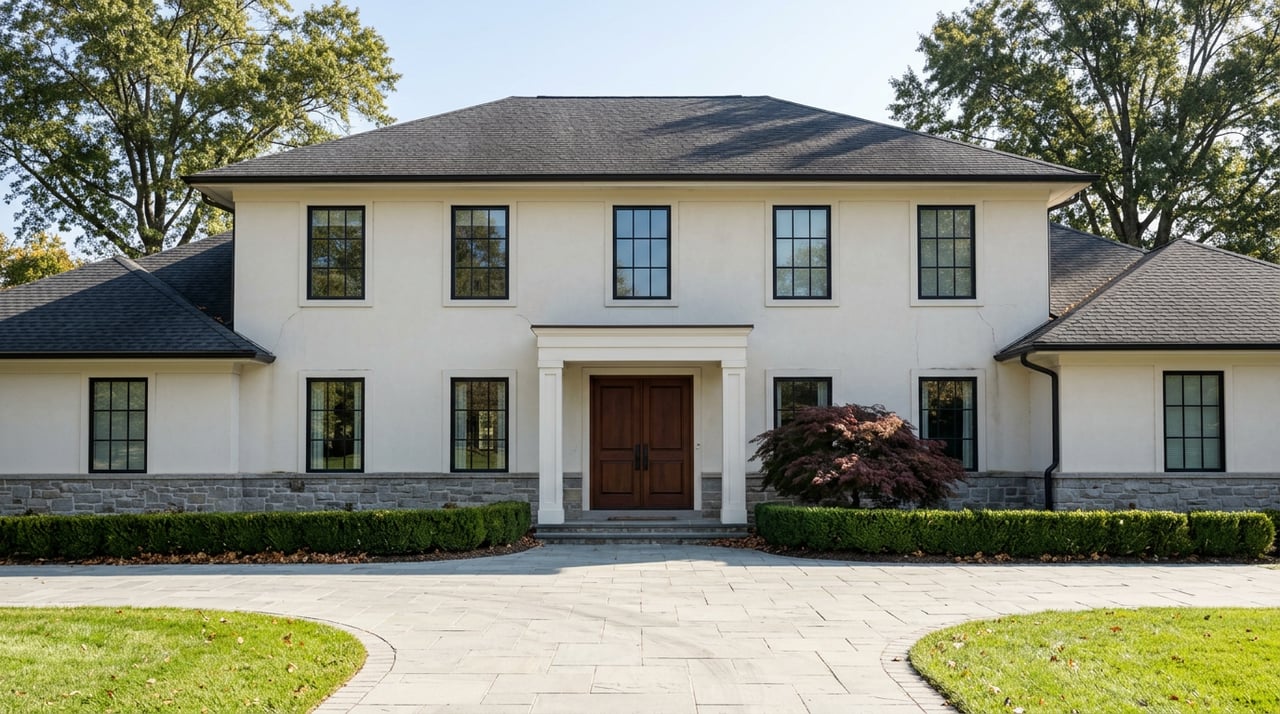
A seller in an established Brentwood subdivision pulls up two market reports in the same week. One says Brentwood is a seller's market: tight inventory, homes moving fast, multiple offers common. The other says the opposite: rising months of supply, more negotiating room, buyers gaining leverage. Same city. Same season. Two headlines that cannot both be describing the same transaction.
They're not wrong. They're just not measuring the same thing.
If you're comparing Brentwood to Franklin or Nolensville, or trying to price a home you already own here, the gap between those two headlines matters more than either number on its own. Understanding why they disagree tells you something the median price never will: which market you're actually standing in.
The Same City, Four Different Supply Numbers
Over the past year, Brentwood's months of supply has been reported at 4.7 for all property types and at roughly 6, 8.7, and 11.6 for single-family homes, all within a twelve-month stretch, all describing conditions in the same city.
| Reported figure | Time window | What it measured |
|---|---|---|
| 4.7 months | December 2025 | All property types, national listing aggregator |
| 6+ months | January 2026 | Single-family, MLS commentary snapshot |
| 8.7 months | Mid-July 2026 | Single-family only, live active listings |
| 11.6 months | Mid-August 2026 | Single-family only, live active listings |
Notice that the two most recent figures, both single-family, both live snapshots, both from the same measurement method, still moved from 8.7 to 11.6 months in a single month. That's not noise. It reflects real inventory building at the top of the market faster than it's absorbing, largely driven by new-construction luxury enclaves like Rosebrooke and Hampton Reserve continuing to deliver product into a price band where buyers are taking longer to commit.
Meanwhile, the lower figure from December 2025 blended every property type, condos and townhomes included, which pulls the number down because attached product in Brentwood moves faster than large-lot single-family homes above $2 million.
A city can read as a buyer's market and a seller's market at the same time. It depends entirely on which slice of the market you're standing in.
Before you trust any Brentwood supply number, ask what it includes. Single-family only or everything. Active listings or closed sales. A six-month window or a rolling year. Those four questions explain almost every contradiction you'll find.
The Real Split Isn't Location. It's Build Era.
Here's the number that matters more than months of supply. In the six months ending in June 2026, Brentwood recorded 461 closed sales at a median price of $1.32 million and $346 per square foot. The same six months produced a $373,000 closing in an established 1980s subdivision and a $4.32 million median in a new-construction enclave delivered in 2024.
That's not two ends of a spectrum. It's two markets sharing a ZIP code, separated almost entirely by when the home was built.
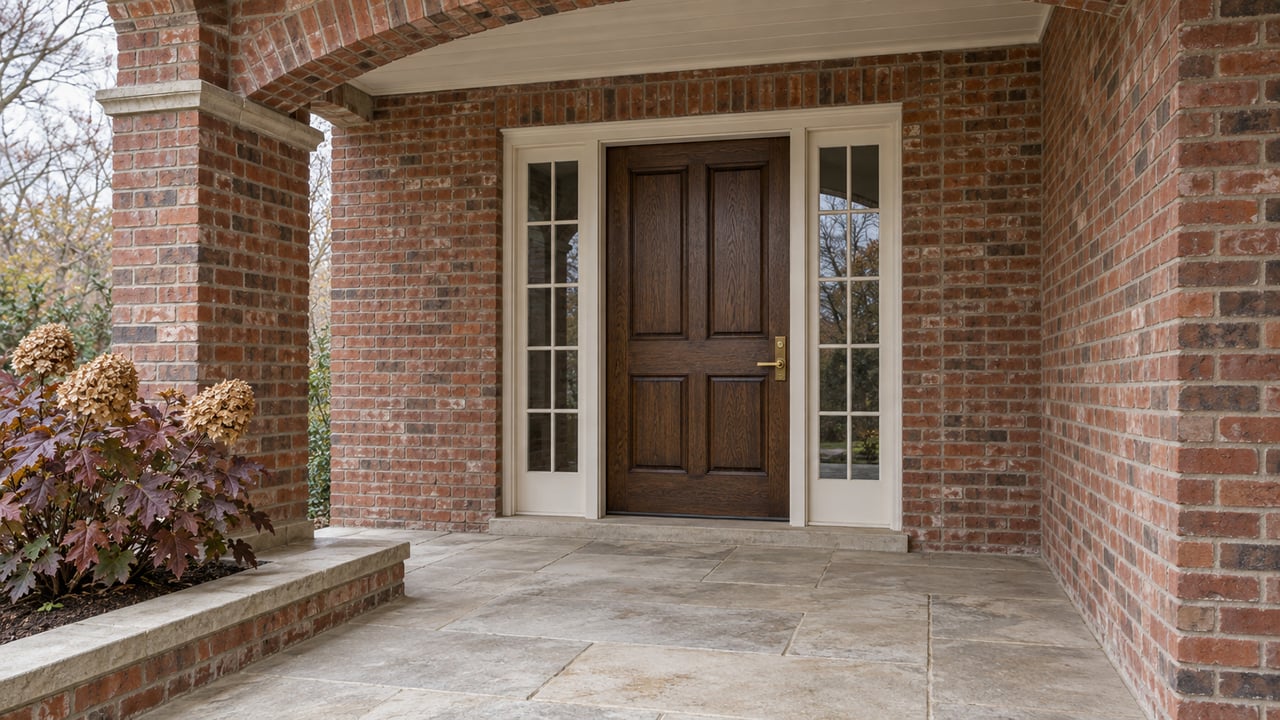
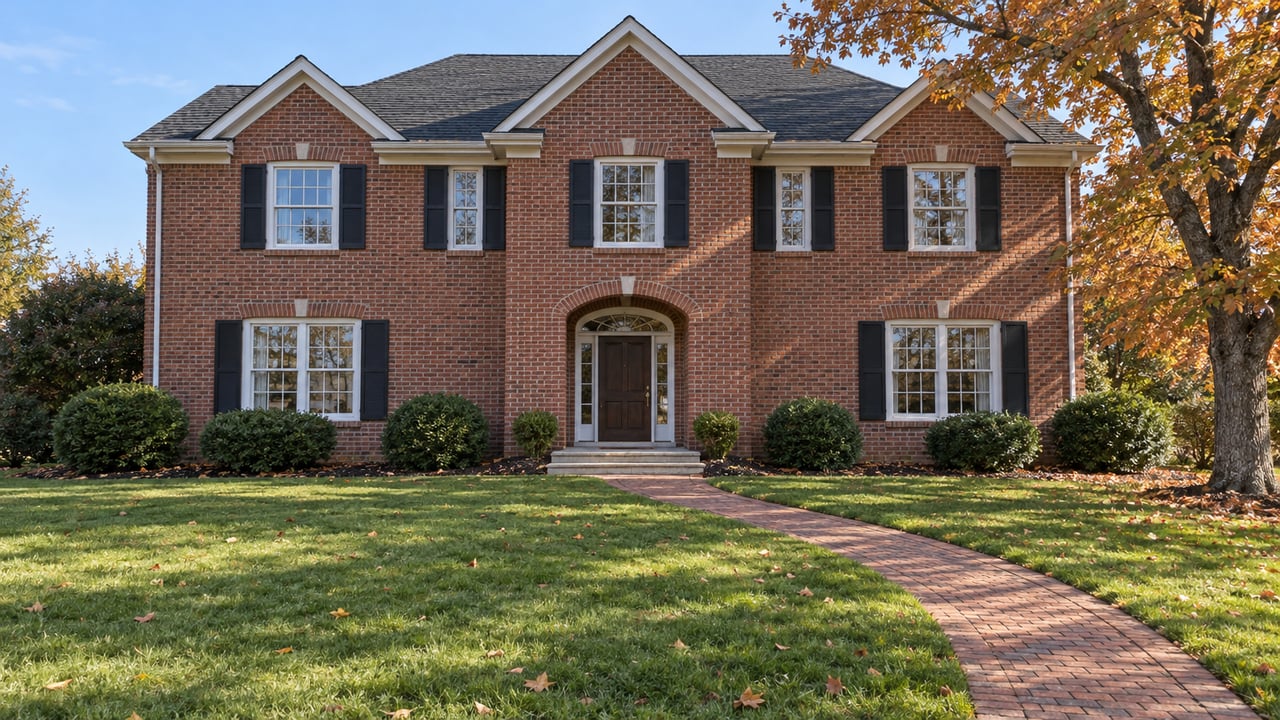
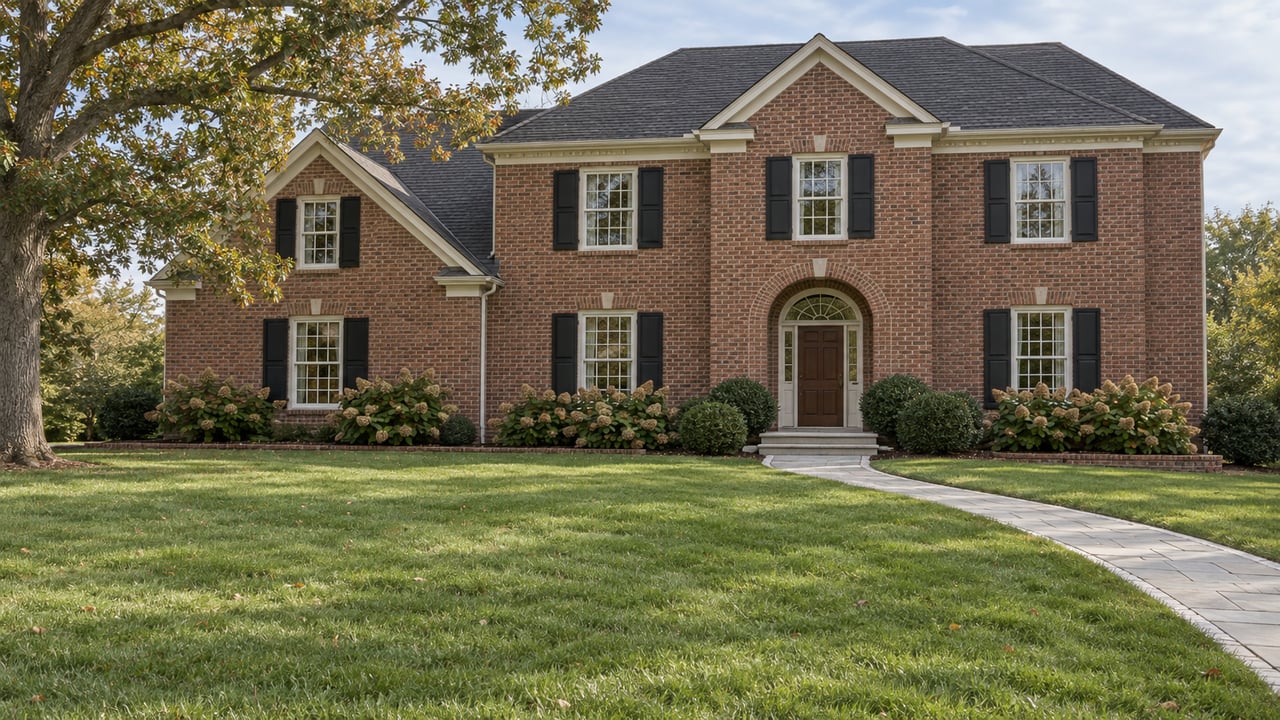
Established neighborhoods like Governors Club, Radnor, Annandale, McGavock Farms, Princeton Hills, and Witherspoon carry the mature canopy, larger lots, and settled streetscapes that Brentwood has been known for since the city's founding in 1969. They're also the only entry point into the Brentwood ZIP code under $1 million, and demand for that entry tier is the broadest in the market.
New-construction communities like Rosebrooke, Calistoga, Primm Farm, and the ultra-exclusive Harlan development are a different buyer pool entirely, commanding roughly double the price per square foot of established stock. The two highest closings in that same six-month cycle were a $9.33 million new build in Bella Collina and an $8.52 million home in Witherspoon, proving that even a legacy neighborhood can produce a trophy sale when the right lot and buyer align.
The practical takeaway: when you're advising yourself on Brentwood, the first question isn't which subdivision. It's whether you're buying new construction or established, because that single choice determines which half of the market your budget is actually competing in.
What This Means If You're Selling an Established Home
If your home sits in one of Brentwood's established subdivisions, resist the temptation to anchor your pricing to the citywide median. That $1.32 million figure is pulled upward by new-construction closings that your home isn't competing against and never will.
The months-of-supply weight sitting above 11 months right now is concentrated disproportionately above $2 million, largely in the new-construction pipeline. If your established home is priced well under that threshold, you're likely in a tighter, faster-moving segment than the headline suggests. Pull comps from homes of comparable build era and lot size, not the citywide blend, and price accordingly.
What This Means If You're Buying Under $1 Million
Established subdivisions remain your most realistic path into Brentwood under $1 million, and that segment isn't behaving like a buyer's market. It's the broadest demand pool in the city, competing for the narrowest supply.
If established inventory feels tight, the growth corridor along Split Log Road is worth watching. Communities including Owl Creek, Tamore, and Raintree Forest are releasing new phases there, which could eventually widen the entry-level options inside city limits. At the same time, luxury infill teardown activity is picking up around Granny White Pike, Meadow Lake, and Bell Road, meaning some of tomorrow's "established" comps are being replaced by new builds today. That shifts what counts as entry-level inventory over time, not overnight.
The Wildcard Nobody's Pricing Yet
Brentwood's Town Center redevelopment, covering roughly 300 acres of the city's existing commercial district, is aimed at improving walkability, updating architectural standards, and adding retail space. It's the kind of infrastructure investment that tends to show up in home values years after the fact, not the week the plans are announced.
The same is true of ongoing I-65 corridor work. The interstate carries more than 120,000 vehicles a day through Williamson County, and interchange and ramp improvements are underway to address that volume. Neither project is reflected in today's closed-sale data, but both will shape commute times and walkability in ways that eventually show up in which established neighborhoods hold their premium and which new-construction enclaves justify their price per square foot.
A Few Questions Worth Asking Before You Trust Any Number
- Is this figure single-family only, or does it include condos and townhomes?
- Is it a live snapshot of active listings, or a closed-sale window?
- What time period does it actually cover, and how recently was it pulled?
- Is the home you're pricing or shopping for established or new construction, and is the comp set matched to that?
If you can't answer those four questions about a number you're reading, treat it as a starting point, not a conclusion.
Let's Talk About Which Market You're Actually In
Brentwood's median price tells you almost nothing about what your specific transaction will look like, and the supply headlines will keep contradicting each other for as long as different sources measure different slices of the same city. What matters is knowing which segment, established or new construction, under $1 million or above $2 million, your home or your search actually falls into.
If you're weighing a sale in one of Brentwood's established neighborhoods, or trying to figure out whether a new-construction listing is priced against the right comps, Donna Walsh eXp Realty TN can walk through the specific data for your specific segment. Let's Connect.